
Nprinting is a recent acquisition by Qlik and the product is used for exporting and publishing reports from QlikView Dashboards. Amongst the limitations that NPrinting imposes on usage of various controls on QlikView dashboard, the most limiting constraint is the usage of Alternate States in QlikView. “Alternate States” is a very common requirement across Business Functions and it becomes almost impossible to deliver some of the end user desired functionality if this feature cannot be used in QlikView Dashboards.
In a recent project of ours which involved NPrinting based reports, we had an end user functionality which would become absolutely meaningless without the usage of Alternate States. That’s when we figured out an alternative workaround on QlikView to deliver the functionality of Alternate States without actually using Alternate States. This way we were able to deliver an “Alternate State” kind of functionality on NPrinting as well.
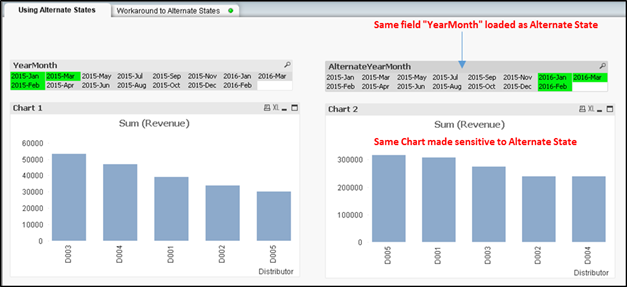
To those who are not familiar with Alternate States, this functionality allows us to provide comparative analysis across different sets of selection on the same Dimension. As an example in the following screenshot the YearMonth field affects Chart 1 which shows the Revenue in those Year Months.
Likewise AlternateYearMonth field affects Chart 2 which shows the Revenue in YearMonths selected in AlternateYearMonth field. You may observe that the same measure (Revenue) is getting compared to different sets of value of the same Dimension (in this case YearMonth).
Alternate States were introduced in QlikView Version 11 and it has helped in delivering many such comparative analysis.
The workaround we developed to using Alternate States is explained below.
- The DataModel for the Dashboard shown above is:

- In this DataModel we add an island Table AlternateCalendar loaded with all unique values of YearMonth. Note that the Island Table is not linked to the Data Model at all.

- Load the AlternateYearMonth field on Dashboard from the newly added island Table AlternateCalendar

- As shown in Chart 2, rewrite the expression for Revenue as:
Sum ({<YearMonth=p(AlternateYearMonth)>}Revenue)
The above steps will help you achieve functionality identical to Alternate States. This can also be used successfully over NPrinting without any issues. At the moment QlikSense does not support Alternate States, though 3rd party extensions are available to meet this functionality. The same approach described above can be used to meet Alternate States functionality in QlikSense also, removing your dependency from 3rd party extensions.
The only additional overhead you carry is that for each Dimension on which Alternate States needs to be delivered, we will need to add Island Tables in the DataModel loaded with all the unique values of the said Dimension. The expression sensitive to Alternate State will have to be rewritten using Set Analysis as shown.
Hope this post helps you out. There is no need to compromise on Alternate States related end user requirements when NPrinting is involved.